| FINANCIAL INDICATORS |
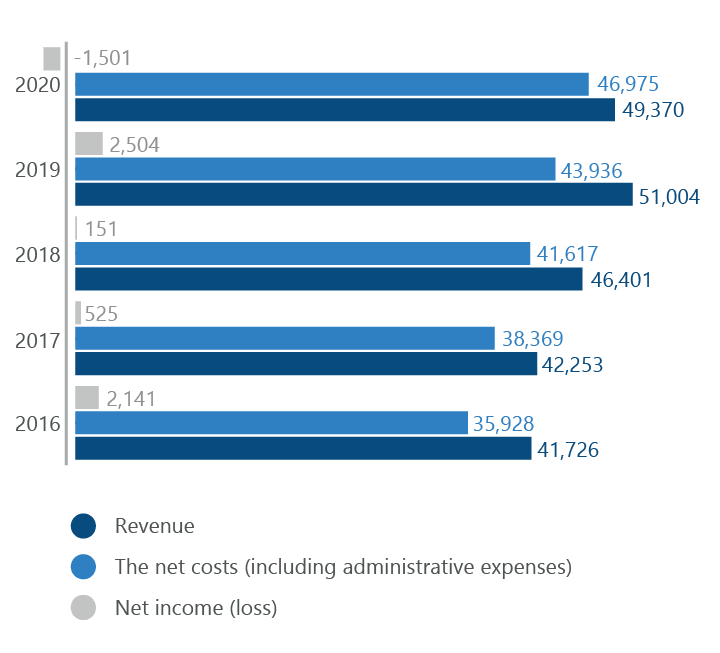
| Revenue | RUB mn | 41,726.2 | 42,253 | 46,401.1 | 51,003.7 | 49,369.6 | –3.2 |
| Including: |
| from sales of power transmission services | RUB mn | 39,262.4 | 41,485.7 | 45,583.5 | 46,515.7 | 48,101.9 | +3.4 |
| from sales of grid connection services | RUB mn | 2,380.5 | 647.9 | 602.5 | 4,206.2 | 731.3 | –82.6 |
| from sales of ancillary services | RUB mn | 83.3 | 119.4 | 215.1 | 281.8 | 536.4 | +90.3 |
| Net costInclusive of administrative costs. | RUB mn | 35,927.8 | 38,369.0 | 41,616.9 | 43,936.1 | 46,975.3 | +6.9 |
| Net income (loss) | RUB mn | 2,140.5 | 525.3 | 151.2 | 2,503.7 | –1,501.3 | –160.0 |
| Return on equity | % | 6.32 | 1.48 | 0.43 | 6.72 | –3.86 | –10.58 |
| Return on assets | % | 5.33 | 1.68 | 1.73 | 4.63 | –1.80 | –6.43 |
| Cash at the end of the year | RUB mn | 1,245.6 | 1,667.7 | 2,194.5 | 1,699.6 | 718.0 | –57.8 |
| Long-term loans and borrowings at the end of the year | RUB mn | 18,912.2 | 22,617.8 | 13,283.2 | 19,432.9 | 17,882.9 | –8.0 |
| Short-term loans and borrowings at the end of the year | RUB mn | 79.1 | 91.0 | 11,395.3 | 3,652.6 | 5,553.9 | +52.1 |
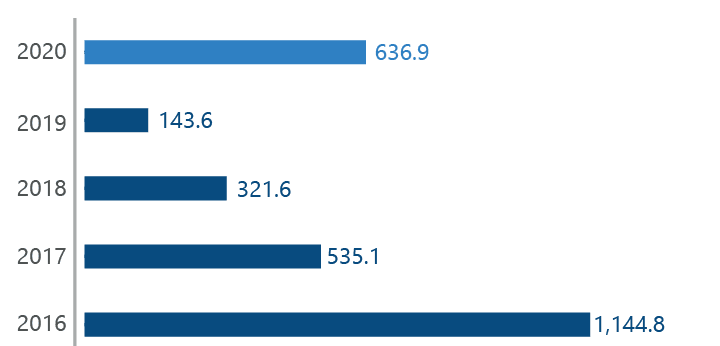
| Amount of dividends accrued in the reporting year based on the previous year results | RUB mn | 1,144.8 | 535.1 | 321.6 | 143.6 | 636.9 | +343.5 |
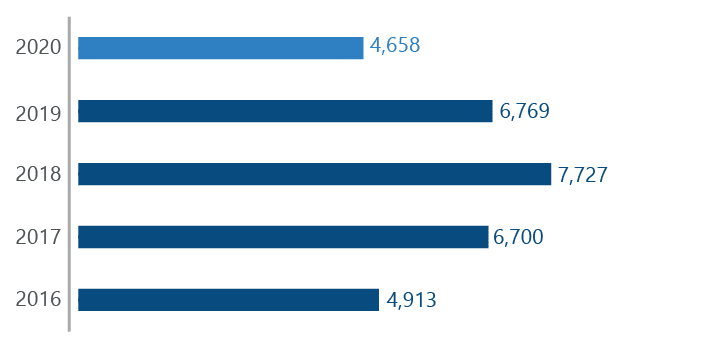
| Application of capital investments | RUB mn | 4,913 | 6,700 | 7,727 | 6,769 | 4,658 | –31.2 |
| OPERATING INDICATORS |
| System Average Interruption Duration Index (Isaidi) | h | – | 1.6577 | 1.1138 | 1.0887 | 0.8870 | –18.5 |
| System Average Interruption Frequency Index (Isaifi) | pcs. | – | 0.9491 | 0.5012 | 0.4675 | 0.4592 | –1.8 |
| The System Average Interruption Duration Index in relation to the point of connection of service consumers to the power grid of the grid organization | h | 0.0124 | – | – | – | – | – |
| Total length of overhead and cable power lines (circuit length) | km | 90,661.0 | 91,106 | 91,000.94 | 91,645.93 | 92226.11 | +0.63 |
| Installed capacity of 35 to 220 kV substations | MVA | 9,519.1 | 9,696.63 | 9,937.1 | 10,514.97 | 11,471.07 | +8.33 |
| Installed capacity of 10 to 6/0.4 kV substations in the distribution grid | MVA | 4,741.061 | 4,805.905 | 4,896.04 | 4,981.68 | 5,073.26 | +1.81 |
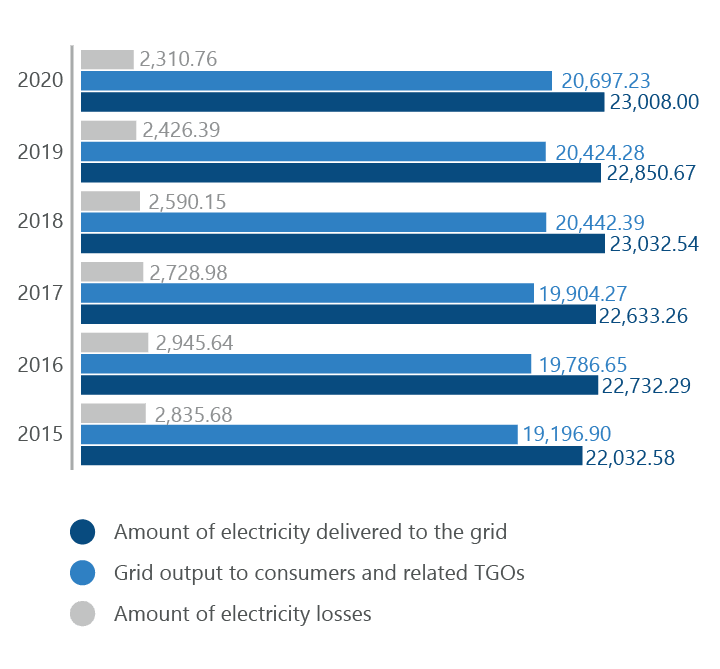
| Electricity delivered to the grid of the Company | mn kWh | 22,732.3 | 22,633.2 | 23,032.5 | 22,850.7 | 23,008.0 | +0.6 |
| Electricity delivered | mn kWh | 18,059.1 | 18,204.1 | 18,766.5 | 18,874.2 | 19,108.1 | +1.2 |
| Electricity losses | mn kWh | 2,945.6 | 2,729.0 | 2,590.1 | 2,426.4 | 2,310.8 | –4.8 |
| Connected consumer capacity | MW | 618 | 684 | 723 | 797 | 650 | –18.4 |
| Actual average staff headcount | ppl. | 8,428 | 8,494 | 8,611 | 8,644 | 8,959 | +3.6 |
| STAFF BREAKDOWN BY EDUCATION |
| Higher vocational education | % | 45.2 | 47.3 | 48.4 | 48.7 | 49.5 | +0.8 |
| Secondary education, basic vocational education | % | 39.4 | 39.2 | 36.5 | 36.1 | 36.7 | +0.6 |
| General secondary education | % | 15.4 | 13.5 | 15.1 | 15.2 | 13.8 | –1.4 |